
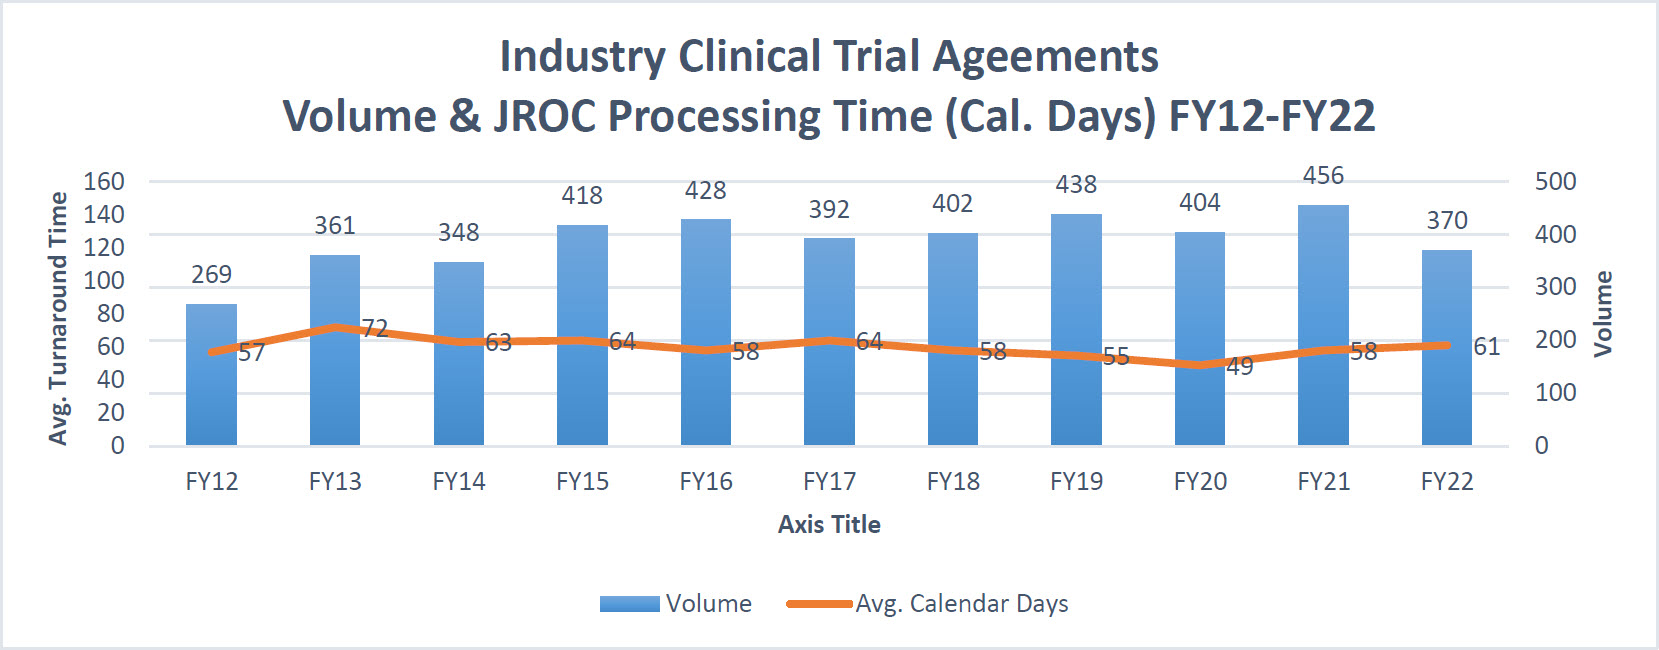
This graph encompasses only new Industry Clinical Trial Agreements.
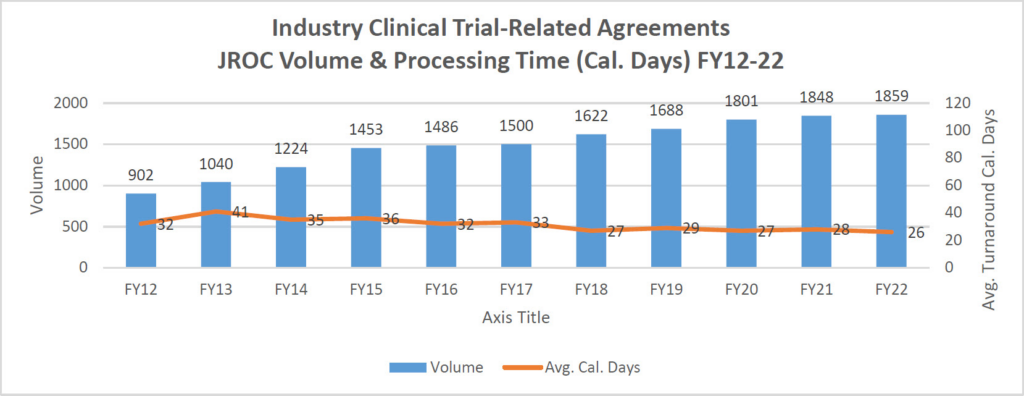
This graph incorporates data from all contracts processed by JROC related to industry clinical trials (e.g. Clinical Trial Agreements, Confidentiality Agreements, Amendments, Service Agreements related to a Clinical Trial, etc.).

Awaiting Intake represents the average time JROC is awaiting documentation needed to begin negotiations.
With Department represents the average time department action is needed to enable JROC to continue processing an Agreement. For CTAs, the majority of this time takes place after JROC has completed negotiations and is awaiting the finalization of the budget by the Department.
With JROC represents the average time JROC is actively processing and negotiating a contract.
With Sponsor represents the average time Sponsor action is needed to enable JROC to continue processing an Agreement.
Routed for Department/Sponsor Signature represents the average days required to collect PI and Sponsor signature after JROC has signed.
